ACA-115 is our cycle analyser for Italian AWP machines. It turns the registers a machine dumps about its own activity into something you can read, compare, and put in front of a client.
The name is not decoration. 115 is the AAMS command that asks an AWP machine to hand over its cycle registers. That dump is the starting point: raw, complete and awkward to handle — data that until now was easier to archive than to use.
From registers to indicators
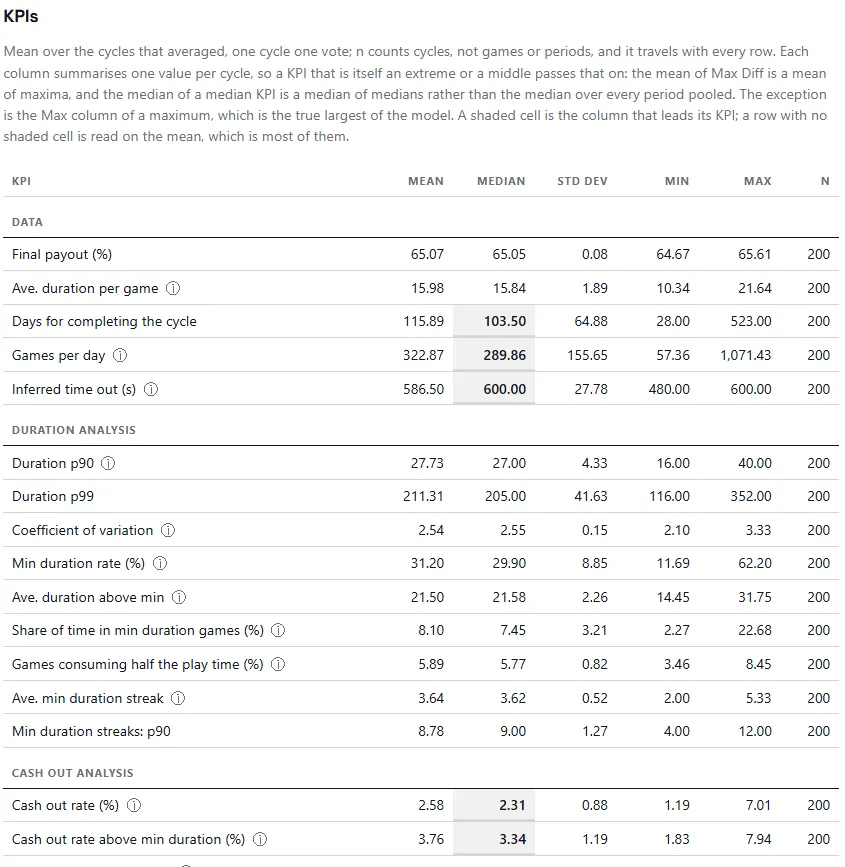
A single cycle says very little. Hundreds of cycles of the same model say a great deal, and that is exactly what ACA-115 does: it averages every available cycle of each model and computes fifty indicators, grouped into five families —general data, game duration, cash outs, hot periods and payouts— which together tell you whether a model behaves on the floor the way it behaved on paper.
Because that is what this is about: the mathematical model says what should happen, and the cycles say what did. The distance between those two is where you learn something.
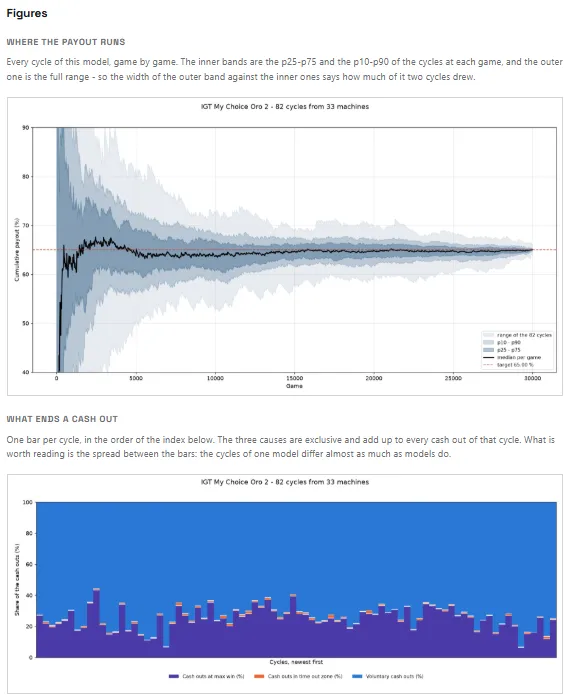
And the numbers do not stop at a table. ACA-115 charts how the payout percentage evolves and how cash outs break down by type —top win, time out and voluntary— which is the most direct way to see how each model delivers its prizes, and how sessions actually end.
Three levels, from the whole to the detail
The report is meant to be read from the top down:
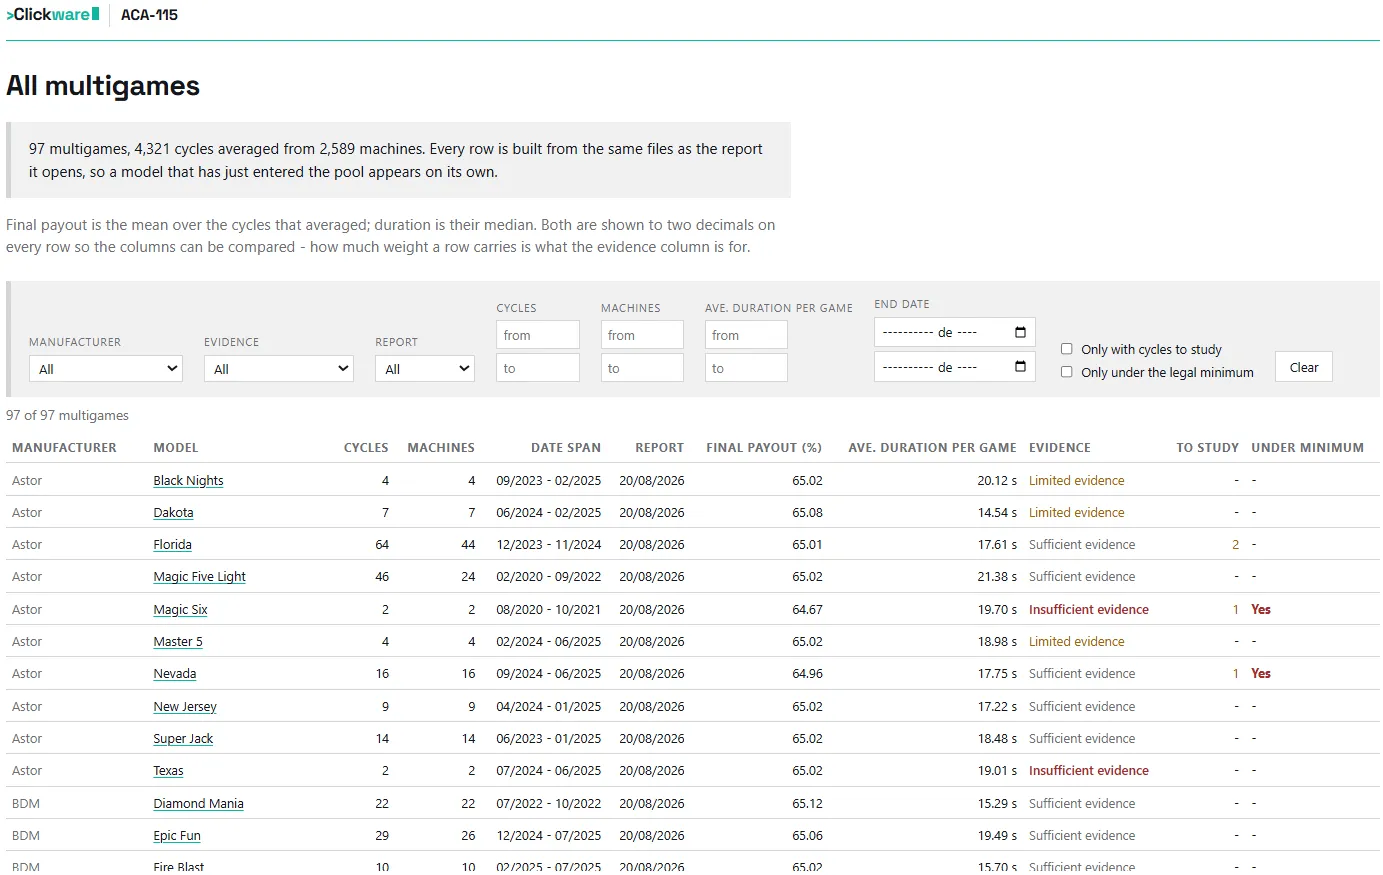
- The model index, with the whole analysed estate at a glance.
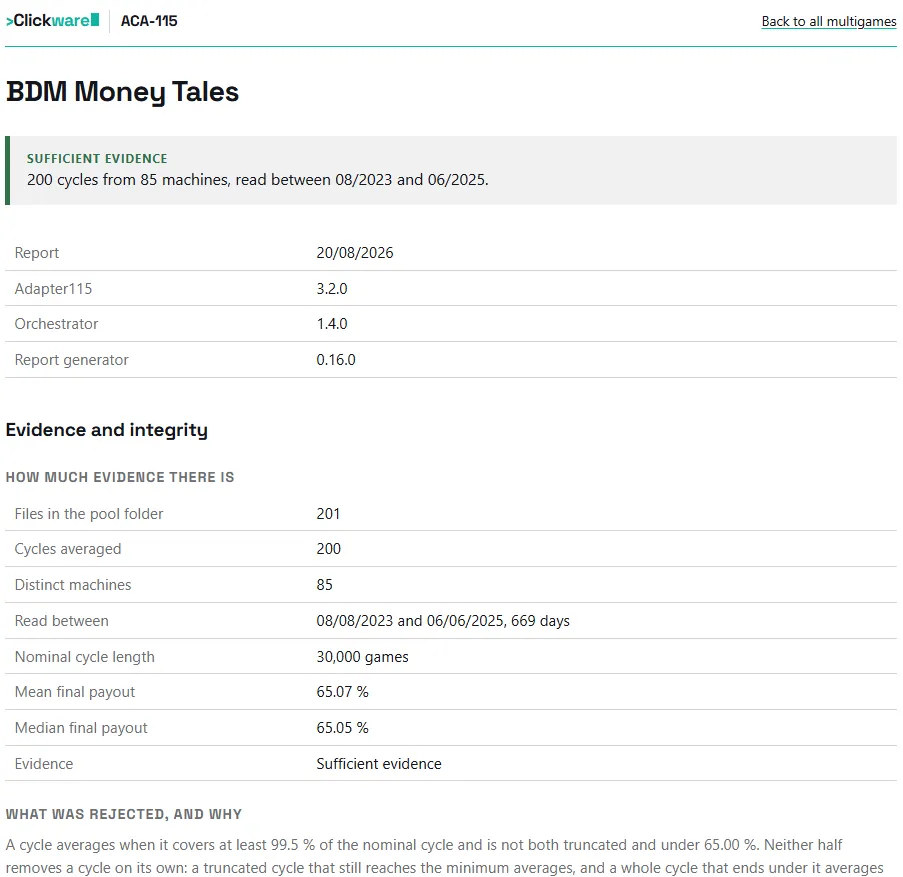
- Each model’s page, with its fifty indicators and its aggregate behaviour.
- Each cycle in detail, for when the question has become specific, with the hot periods ACA-115 detects and lists one by one.
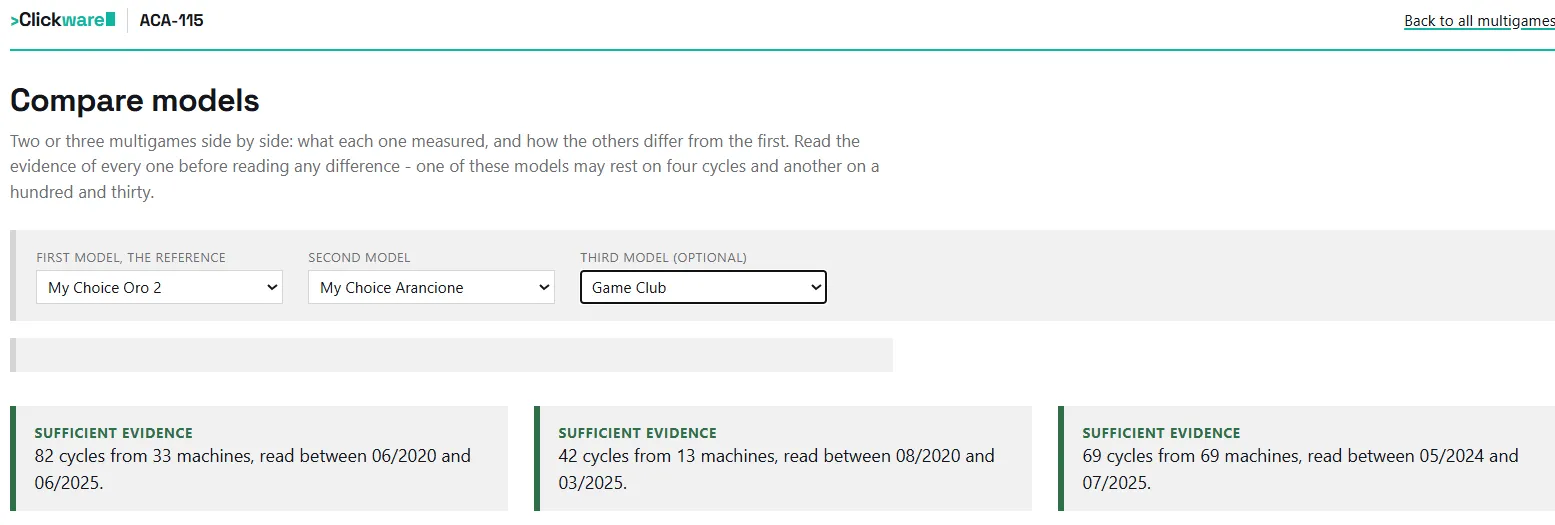
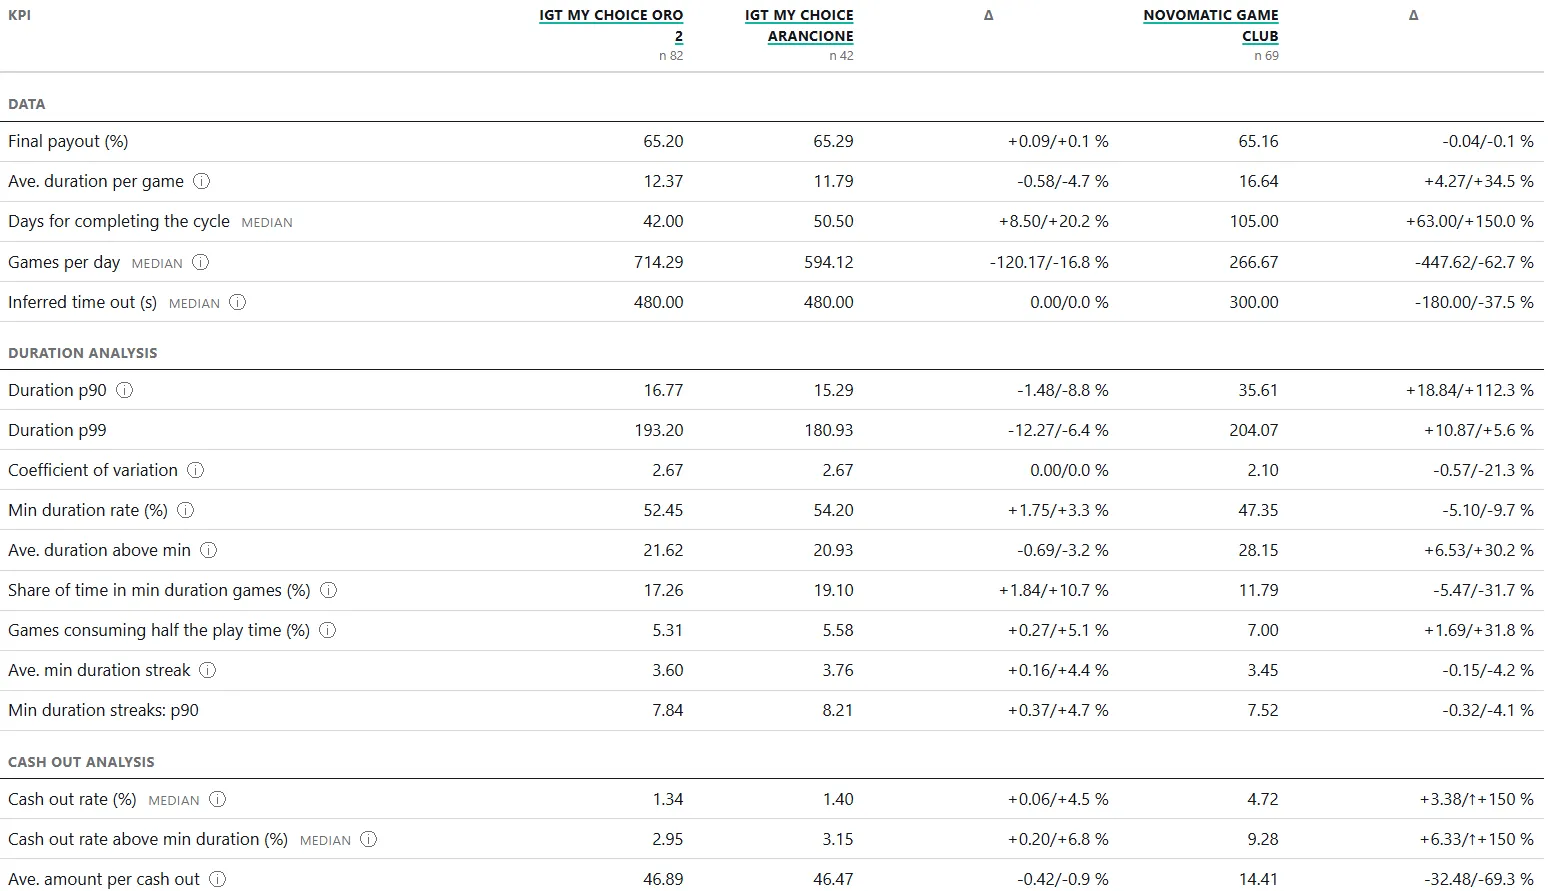
On top of that, a comparison that puts up to three models side by side, indicator by indicator — which is how a real conversation usually starts: this one performs better than that one; in what exactly?
How it is delivered
ACA-115 is not installed anywhere. The client sends us their registers, we process them, and the report becomes available in the private area of this site, behind credentials.
For now ACA-115 works on the data of those who already work with us. We will keep sharing what we learn with it.
The fifty indicators
Five families, one table
Every indicator with its mean, median, deviation and extremes, and the number of cycles it comes from. The shaded cell marks how each row is meant to be read.
Inside the report